


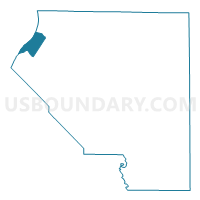
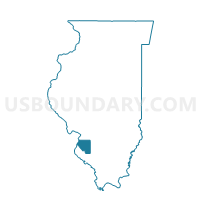
Census Tract 5023, St. Clair County, Illinois
About
Outline

Summary
| Unique Area Identifier | 454218 |
| Name | Census Tract 5023 |
| County | St. Clair County |
| State | Illinois |
| Area (square miles) | 8.23 |
| Land Area (square miles) | 7.18 |
| Water Area (square miles) | 1.05 |
| % of Land Area | 87.24 |
| % of Water Area | 12.76 |
| Latitude of the Internal Point | 38.58012240 |
| Longtitude of the Internal Point | -90.19080570 |
| Total Population | 6,415 |
| Total Housing Units | 2,732 |
| Total Households | 2,308 |
| Median Age | 30.4 |
Maps

Graphs
Select a template below for downloading or customizing gragh for Census Tract 5023, St. Clair County, Illinois


Neighbors
Neighoring Census Tract (by Name) Neighboring Census Tract on the Map
- Census Tract 1018, St. Louis city, MO
- Census Tract 1156, St. Louis city, MO
- Census Tract 1157, St. Louis city, MO
- Census Tract 1246, St. Louis city, MO
- Census Tract 1276, St. Louis city, MO
- Census Tract 5026.02, St. Clair County, IL
- Census Tract 5026.03, St. Clair County, IL
- Census Tract 5031, St. Clair County, IL
- Census Tract 5045, St. Clair County, IL
Top 10 Neighboring County Subdivision (by Population) Neighboring County Subdivision on the Map
- St. Louis city, St. Louis city, MO (319,294)
- East St. Louis township, St. Clair County, IL (27,006)
- Centreville township, St. Clair County, IL (25,386)
- Sugar Loaf township, St. Clair County, IL (7,322)
Top 10 Neighboring Place (by Population) Neighboring Place on the Map
- St. Louis city, MO (319,294)
- East St. Louis city, IL (27,006)
- Cahokia village, IL (15,241)
- Sauget village, IL (159)
Top 10 Neighboring Unified School District (by Population) Neighboring Unified School District on the Map
- St. Louis City School District, MO (319,294)
- East St. Louis School District 189, IL (38,523)
- Cahokia Community Unit School District 187, IL (19,392)
- Dupo Community Unit School District 196, IL (7,094)
Top 10 Neighboring State Legislative District Lower Chamber (by Population) Neighboring State Legislative District Lower Chamber on the Map
- State House District 116, IL (110,789)
- State House District 114, IL (104,780)
- State House District 63, MO (36,309)
- State House District 108, MO (32,101)
- State House District 59, MO (30,270)
Top 10 Neighboring State Legislative District Upper Chamber (by Population) Neighboring State Legislative District Upper Chamber on the Map
- State Senate District 58, IL (216,350)
- State Senate District 57, IL (209,245)
- State Senate District 5, MO (152,705)
Top 10 Neighboring 111th Congressional District (by Population) Neighboring 111th Congressional District on the Map
Top 10 Neighboring 5-Digit ZIP Code Tabulation Area (by Population) Neighboring 5-Digit ZIP Code Tabulation Area on the Map
- 63118, MO (26,704)
- 63111, MO (20,313)
- 63104, MO (18,656)
- 62206, IL (16,509)
- 62207, IL (8,750)
- 62201, IL (7,547)
- 62240, IL (1,966)
Data
Demographic, Population, Households, and Housing Units
** Data sources from census 2010 **
Show Data on Map
Download Full List as CSV
Download Quick Sheet as CSV
| Subject | This Area | St. Clair County | Illinois | National |
|---|---|---|---|---|
| POPULATION | ||||
| Total Population Map | 6,415 | 270,056 | 12,830,632 | 308,745,538 |
| POPULATION, HISPANIC OR LATINO ORIGIN | ||||
| Not Hispanic or Latino Map | 6,298 | 261,271 | 10,803,054 | 258,267,944 |
| Hispanic or Latino Map | 117 | 8,785 | 2,027,578 | 50,477,594 |
| POPULATION, RACE | ||||
| White alone Map | 2,400 | 174,458 | 9,177,877 | 223,553,265 |
| Black or African American alone Map | 3,808 | 82,302 | 1,866,414 | 38,929,319 |
| American Indian and Alaska Native alone Map | 11 | 652 | 43,963 | 2,932,248 |
| Asian alone Map | 8 | 3,276 | 586,934 | 14,674,252 |
| Native Hawaiian and Other Pacific Islander alone Map | 1 | 227 | 4,050 | 540,013 |
| Some Other Race alone Map | 52 | 3,133 | 861,412 | 19,107,368 |
| Two or More Races Map | 135 | 6,008 | 289,982 | 9,009,073 |
| POPULATION, SEX | ||||
| Male Map | 2,930 | 129,976 | 6,292,276 | 151,781,326 |
| Female Map | 3,485 | 140,080 | 6,538,356 | 156,964,212 |
| POPULATION, AGE (18 YEARS) | ||||
| 18 years and over Map | 4,340 | 201,468 | 9,701,453 | 234,564,071 |
| Under 18 years | 2,075 | 68,588 | 3,129,179 | 74,181,467 |
| POPULATION, AGE | ||||
| Under 5 years | 557 | 18,398 | 835,577 | 20,201,362 |
| 5 to 9 years | 561 | 18,671 | 859,405 | 20,348,657 |
| 10 to 14 years | 584 | 19,182 | 879,448 | 20,677,194 |
| 15 to 17 years | 373 | 12,337 | 554,749 | 12,954,254 |
| 18 and 19 years | 215 | 7,417 | 367,343 | 9,086,089 |
| 20 years | 95 | 3,503 | 179,613 | 4,519,129 |
| 21 years | 88 | 3,484 | 172,795 | 4,354,294 |
| 22 to 24 years | 260 | 10,439 | 526,556 | 12,712,576 |
| 25 to 29 years | 431 | 18,105 | 910,273 | 21,101,849 |
| 30 to 34 years | 439 | 17,073 | 865,684 | 19,962,099 |
| 35 to 39 years | 438 | 17,358 | 855,790 | 20,179,642 |
| 40 to 44 years | 389 | 17,859 | 870,100 | 20,890,964 |
| 45 to 49 years | 427 | 20,764 | 940,094 | 22,708,591 |
| 50 to 54 years | 384 | 20,542 | 930,785 | 22,298,125 |
| 55 to 59 years | 338 | 17,521 | 807,778 | 19,664,805 |
| 60 and 61 years | 114 | 5,800 | 284,180 | 7,113,727 |
| 62 to 64 years | 140 | 7,793 | 381,249 | 9,704,197 |
| 65 and 66 years | 67 | 4,214 | 205,270 | 5,319,902 |
| 67 to 69 years | 90 | 5,565 | 279,790 | 7,115,361 |
| 70 to 74 years | 151 | 7,473 | 364,475 | 9,278,166 |
| 75 to 79 years | 131 | 6,486 | 289,385 | 7,317,795 |
| 80 to 84 years | 96 | 5,366 | 235,381 | 5,743,327 |
| 85 years and over | 47 | 4,706 | 234,912 | 5,493,433 |
| MEDIAN AGE BY SEX | ||||
| Both sexes Map | 30.40 | 36.90 | 36.60 | 37.20 |
| Male Map | 28.40 | 35.40 | 35.20 | 35.80 |
| Female Map | 31.70 | 38.30 | 37.90 | 38.50 |
| HOUSEHOLDS | ||||
| Total Households Map | 2,308 | 105,045 | 4,836,972 | 116,716,292 |
| HOUSEHOLDS, HOUSEHOLD TYPE | ||||
| Family households: Map | 1,607 | 70,689 | 3,182,984 | 77,538,296 |
| Husband-wife family Map | 698 | 46,846 | 2,332,995 | 56,510,377 |
| Other family: Map | 909 | 23,843 | 849,989 | 21,027,919 |
| Male householder, no wife present Map | 153 | 5,254 | 227,684 | 5,777,570 |
| Female householder, no husband present Map | 756 | 18,589 | 622,305 | 15,250,349 |
| Nonfamily households: Map | 701 | 34,356 | 1,653,988 | 39,177,996 |
| Householder living alone Map | 584 | 28,916 | 1,346,312 | 31,204,909 |
| Householder not living alone Map | 117 | 5,440 | 307,676 | 7,973,087 |
| HOUSEHOLDS, HISPANIC OR LATINO ORIGIN OF HOUSEHOLDER | ||||
| Not Hispanic or Latino householder: Map | 2,267 | 102,661 | 4,329,737 | 103,254,926 |
| Hispanic or Latino householder: Map | 41 | 2,384 | 507,235 | 13,461,366 |
| HOUSEHOLDS, RACE OF HOUSEHOLDER | ||||
| Householder who is White alone | 1,098 | 71,865 | 3,680,912 | 89,754,352 |
| Householder who is Black or African American alone | 1,162 | 29,832 | 668,152 | 14,129,983 |
| Householder who is American Indian and Alaska Native alone | 5 | 265 | 13,449 | 939,707 |
| Householder who is Asian alone | 5 | 1,002 | 192,603 | 4,632,164 |
| Householder who is Native Hawaiian and Other Pacific Islander alone | 1 | 79 | 1,278 | 143,932 |
| Householder who is Some Other Race alone | 13 | 765 | 213,509 | 4,916,427 |
| Householder who is Two or More Races | 24 | 1,237 | 67,069 | 2,199,727 |
| HOUSEHOLDS, HOUSEHOLD TYPE BY HOUSEHOLD SIZE | ||||
| Family households: Map | 1,607 | 70,689 | 3,182,984 | 77,538,296 |
| 2-person household Map | 551 | 28,950 | 1,259,669 | 31,882,616 |
| 3-person household Map | 381 | 17,408 | 720,213 | 17,765,829 |
| 4-person household Map | 340 | 13,970 | 644,972 | 15,214,075 |
| 5-person household Map | 179 | 6,482 | 326,688 | 7,411,997 |
| 6-person household Map | 87 | 2,373 | 132,759 | 3,026,278 |
| 7-or-more-person household Map | 69 | 1,506 | 98,683 | 2,237,501 |
| Nonfamily households: Map | 701 | 34,356 | 1,653,988 | 39,177,996 |
| 1-person household Map | 584 | 28,916 | 1,346,312 | 31,204,909 |
| 2-person household Map | 97 | 4,559 | 250,239 | 6,360,012 |
| 3-person household Map | 13 | 566 | 36,254 | 992,156 |
| 4-person household Map | 1 | 216 | 14,759 | 411,171 |
| 5-person household Map | 4 | 64 | 3,959 | 126,634 |
| 6-person household Map | 0 | 19 | 1,433 | 48,421 |
| 7-or-more-person household Map | 2 | 16 | 1,032 | 34,693 |
| HOUSING UNITS | ||||
| Total Housing Units Map | 2,732 | 116,249 | 5,296,715 | 131,704,730 |
| HOUSING UNITS, OCCUPANCY STATUS | ||||
| Occupied Map | 2,308 | 105,045 | 4,836,972 | 116,716,292 |
| Vacant Map | 424 | 11,204 | 459,743 | 14,988,438 |
| HOUSING UNITS, OCCUPIED, TENURE | ||||
| Owned with a mortgage or a loan Map | 748 | 48,475 | 2,338,493 | 52,979,430 |
| Owned free and clear Map | 476 | 21,171 | 925,146 | 23,006,644 |
| Renter occupied Map | 1,084 | 35,399 | 1,573,333 | 40,730,218 |
| HOUSING UNITS, VACANT, VACANCY STATUS | ||||
| For rent Map | 197 | 3,750 | 158,882 | 4,137,567 |
| Rented, not occupied Map | 22 | 177 | 7,998 | 206,825 |
| For sale only Map | 107 | 1,938 | 82,739 | 1,896,796 |
| Sold, not occupied Map | 12 | 543 | 16,677 | 421,032 |
| For seasonal, recreational, or occasional use Map | 2 | 301 | 47,289 | 4,649,298 |
| For migrant workers Map | 0 | 34 | 315 | 24,161 |
| Other vacant Map | 84 | 4,461 | 145,843 | 3,652,759 |
| HOUSING UNITS, OCCUPIED, AVERAGE HOUSEHOLD SIZE BY TENURE | ||||
| Total: Map | 2.78 | 2.53 | 2.59 | 2.58 |
| Owner occupied Map | 2.53 | 2.58 | 2.69 | 2.65 |
| Renter occupied Map | 3.06 | 2.42 | 2.38 | 2.44 |
| HOUSING UNITS, OCCUPIED, TENURE BY RACE OF HOUSEHOLDER | ||||
| Owner occupied: Map | 1,224 | 69,646 | 3,263,639 | 75,986,074 |
| Householder who is White alone Map | 828 | 54,603 | 2,728,000 | 63,446,275 |
| Householder who is Black or African American alone Map | 369 | 13,144 | 272,489 | 6,261,464 |
| Householder who is American Indian and Alaska Native alone Map | 4 | 166 | 6,873 | 509,588 |
| Householder who is Asian alone Map | 4 | 650 | 118,649 | 2,688,861 |
| Householder who is Native Hawaiian and Other Pacific Islander alone Map | 0 | 45 | 644 | 61,911 |
| Householder who is Some Other Race alone Map | 9 | 408 | 103,641 | 1,975,817 |
| Householder who is Two or More Races Map | 10 | 630 | 33,343 | 1,042,158 |
| Renter occupied: Map | 1,084 | 35,399 | 1,573,333 | 40,730,218 |
| Householder who is White alone Map | 270 | 17,262 | 952,912 | 26,308,077 |
| Householder who is Black or African American alone Map | 793 | 16,688 | 395,663 | 7,868,519 |
| Householder who is American Indian and Alaska Native alone Map | 1 | 99 | 6,576 | 430,119 |
| Householder who is Asian alone Map | 1 | 352 | 73,954 | 1,943,303 |
| Householder who is Native Hawaiian and Other Pacific Islander alone Map | 1 | 34 | 634 | 82,021 |
| Householder who is Some Other Race alone Map | 4 | 357 | 109,868 | 2,940,610 |
| Householder who is Two or More Races Map | 14 | 607 | 33,726 | 1,157,569 |
| HOUSING UNITS, OCCUPIED, TENURE BY HISPANIC OR LATINO ORIGIN OF HOUSEHOLDER | ||||
| Owner occupied: Map | 1,224 | 69,646 | 3,263,639 | 75,986,074 |
| Not Hispanic or Latino householder Map | 1,199 | 68,221 | 2,996,581 | 69,617,625 |
| Hispanic or Latino householder Map | 25 | 1,425 | 267,058 | 6,368,449 |
| Renter occupied: Map | 1,084 | 35,399 | 1,573,333 | 40,730,218 |
| Not Hispanic or Latino householder Map | 1,068 | 34,440 | 1,333,156 | 33,637,301 |
| Hispanic or Latino householder Map | 16 | 959 | 240,177 | 7,092,917 |
| HOUSING UNITS, OCCUPIED, TENURE BY HOUSEHOLD SIZE | ||||
| Owner occupied: Map | 1,224 | 69,646 | 3,263,639 | 75,986,074 |
| 1-person household Map | 339 | 15,792 | 732,688 | 16,453,569 |
| 2-person household Map | 405 | 24,884 | 1,111,442 | 27,618,605 |
| 3-person household Map | 196 | 12,151 | 529,763 | 12,517,563 |
| 4-person household Map | 152 | 10,067 | 493,300 | 10,998,793 |
| 5-person household Map | 80 | 4,361 | 238,851 | 5,057,765 |
| 6-person household Map | 29 | 1,508 | 92,193 | 1,965,796 |
| 7-or-more-person household Map | 23 | 883 | 65,402 | 1,373,983 |
| Renter occupied: Map | 1,084 | 35,399 | 1,573,333 | 40,730,218 |
| 1-person household Map | 245 | 13,124 | 613,624 | 14,751,340 |
| 2-person household Map | 243 | 8,625 | 398,466 | 10,624,023 |
| 3-person household Map | 198 | 5,823 | 226,704 | 6,240,422 |
| 4-person household Map | 189 | 4,119 | 166,431 | 4,626,453 |
| 5-person household Map | 103 | 2,185 | 91,796 | 2,480,866 |
| 6-person household Map | 58 | 884 | 41,999 | 1,108,903 |
| 7-or-more-person household Map | 48 | 639 | 34,313 | 898,211 |
Loading...